Calibrated Sports — Multi-Sport Market Analytics Platform
Sept 2026 – Present · Personal Project
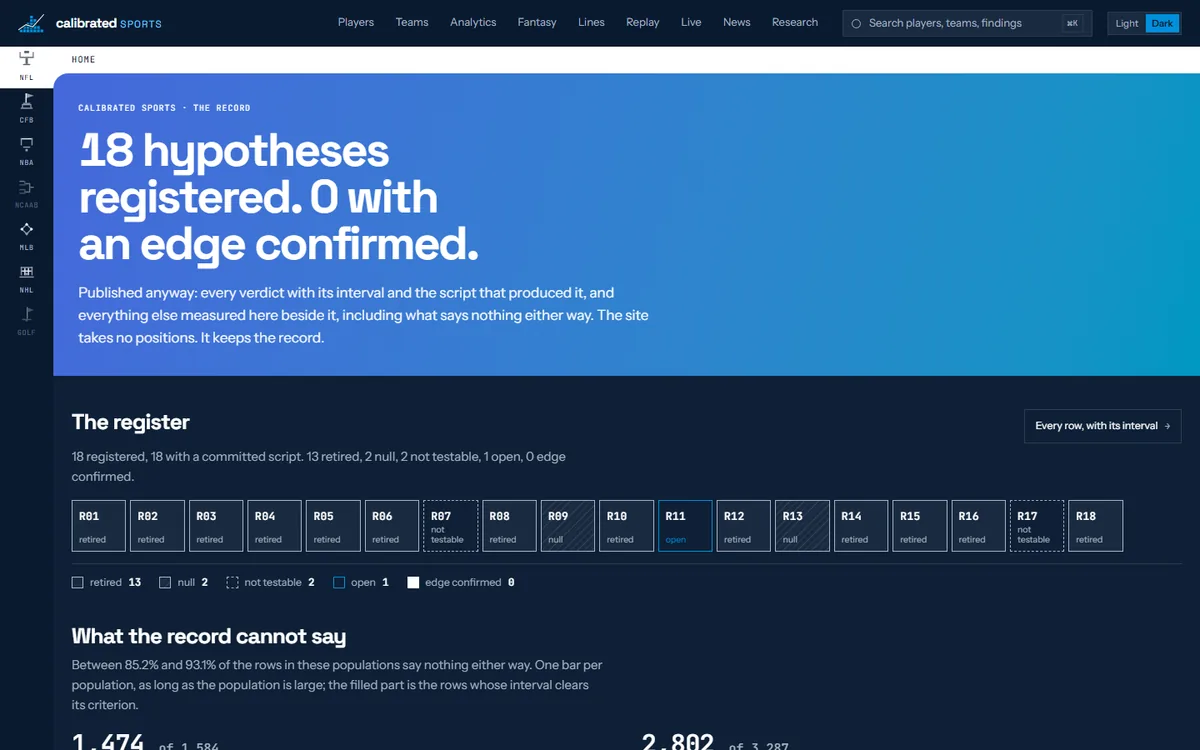
- Deployed end to end on Next.js, Cloudflare Workers and R2 at calibratedsports.com, with a 552,646 row strategy backtest engine, an append only forecast ledger graded in public, and a contract gated export covering 1,270 tests
- Built a platform converting prediction market ladders and sportsbook odds into full outcome distributions for every priced player, fitting isotonic survival curves and a Gaussian copula Monte Carlo over 3,988 players and 7,309 games from 1999 forward
- Pre registered and published 18 hypotheses under walk forward validation, measuring a 2.43 pp over side bias (95% CI 1.72 to 3.13) across 44,198 settled props and scoring the in house model against the closing line on 14,857 out of sample predictions
Photo Atlas

Personal photography portfolio on an interactive 3D globe. EXIF-driven metadata, filterable gallery, journey playback across 200+ photos and 22 places.
Factor-Based Index Tracking — Direct Indexing with PCA Leader Stocks
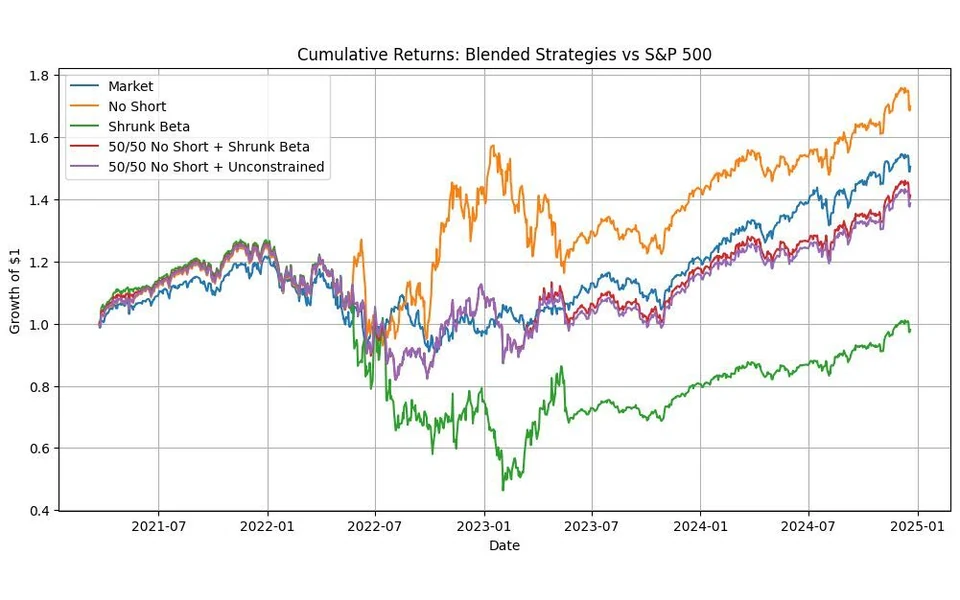
- Replicated the S&P 500 with a 30–50 stock subset: extracted the top 5 PCA factors from a 488-stock universe, then selected leader stocks by factor correlation and residual regression until R² ≥ 95%, following Jiang & Perez (2021)
- Built max-Sharpe portfolios with beta-proxied expected returns and ±25% weight bounds under three constraint sets (unconstrained, no short-selling, shrunk beta); the no-short portfolio tracked best, consistent with non-negativity acting as regularization (Jagannathan & Ma, 2003)
- Stress-tested across the 2022–23 regime shift, when average pairwise correlation jumped from 0.25 to 0.5 and 252-day tracking correlation fell from 0.945 to 0.413; measured the stability vs adaptability trade-off across estimation windows (turnover 99% at 21 days vs 73% at 252 days) and extended to the Russell 1000/2000 (tracking-error vol 9.8% S&P 500, 11.0% R1000, 22.9% R2000)
Systematic Trading & Research Platform
Feb 2026 – Present
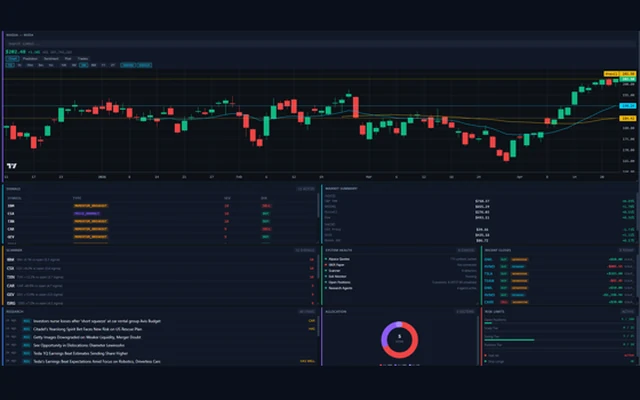
- Python event-driven backtest framework: walk-forward CV, block bootstrap, BH-FDR correction; 90-config sweep across detectors, hold periods, and HMM regimes on Russell 1000 tick + order-flow data
- Extended to prediction markets via Kalshi + Polymarket capture — 18,000+ subscriptions at ~1,100 msg/sec, 14M+ events across sports and event contracts for signal generation
Optimal Pairs Trading via Free-Boundary PDEs
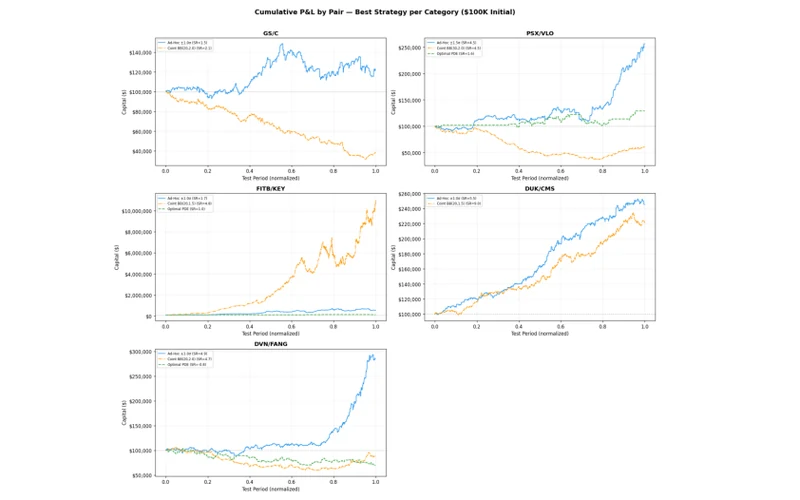
A graduate research project (MF821) that fits a VAR(1) cointegration model on intraday mid-prices for five sector-diversified pairs, extracts the cointegration factor via spectral decomposition, and solves free-boundary PDEs by finite differences to derive time-dependent optimal entry/exit bands. Backtested out-of-sample against ad-hoc σ-bands and Bollinger heuristics across 200+ trading days using real NBBO spread costs.
Sentiment Trading Signals from Earnings Reports and Financial News
Sept – Dec 2025
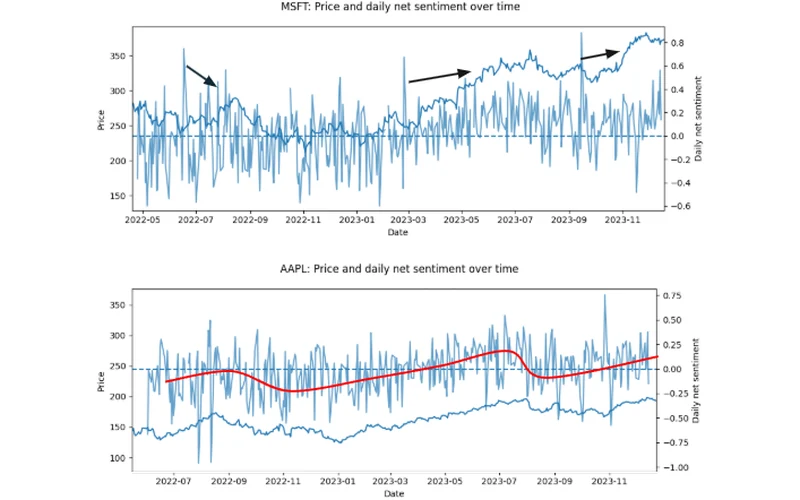
An LLM-driven sentiment-to-signal framework for equities that scores news and filings with FinBERT, layers in cross-source disagreement features, and converts them to z-score thresholds for entry/exit. Designed as a reproducible out-of-sample evaluation pipeline rather than a curve-fit backtest.
MLB Toolbox — Player Efficiency & Valuation Platform
Sept 2025 – June 2026
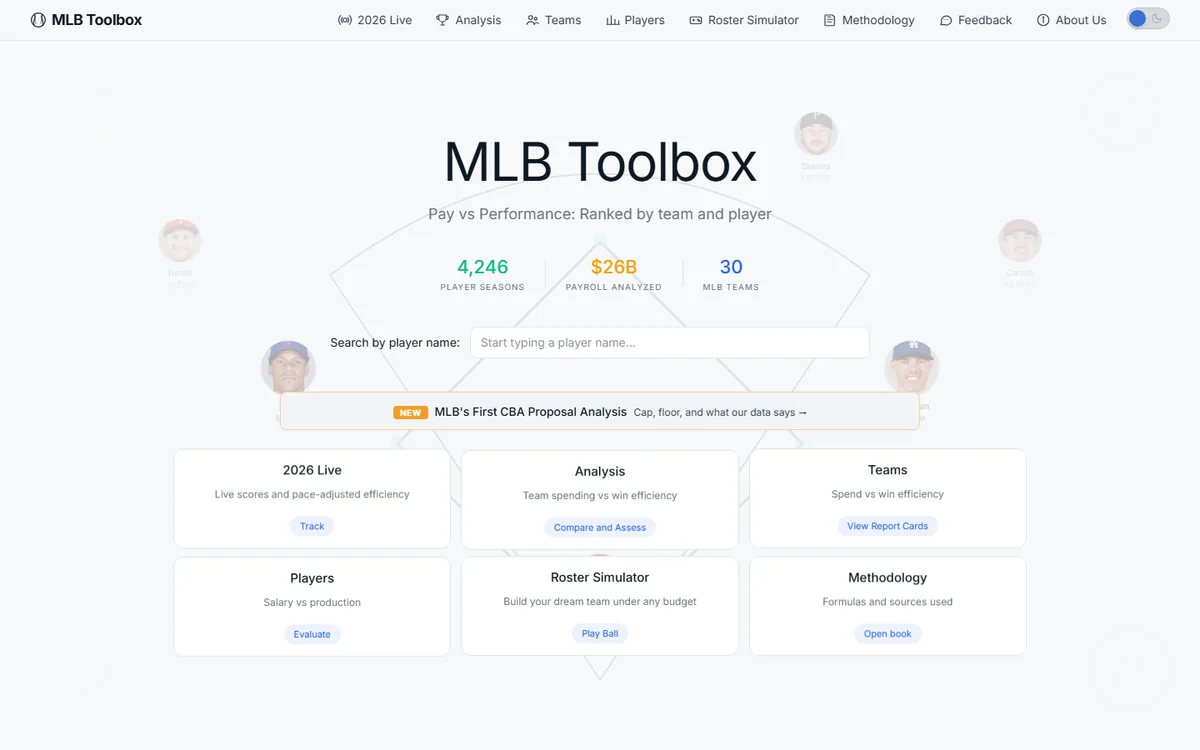
- Modeled salary vs fWAR across 4,246 player seasons in Python; regression residuals flag over/underpaid contracts, positional scarcity, age curves, and development efficiency
- Built end-to-end on Next.js, FastAPI, and Cloudflare R2 with a 14-dimension team contention model and roster simulator
Bermudan Swaption Pricing Pipeline
Apr 2026
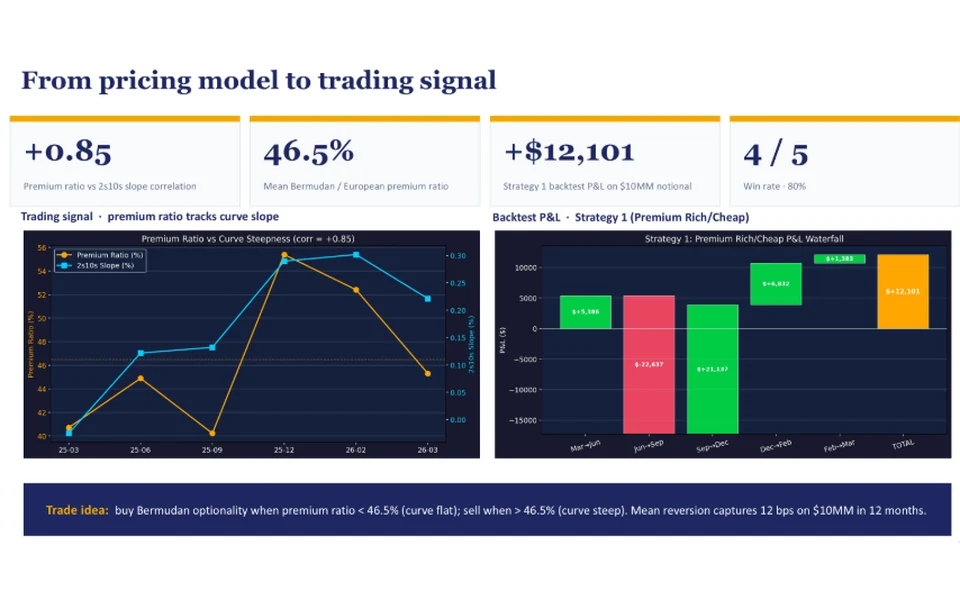
- Four-stage pricing pipeline (MF728, three-person team) for a 1Y×5Y ATM payer Bermudan on $10MM notional, benchmarked against Bloomberg’s HW1F NPV of $235,823: SOFR curve → SABR calibration → LMM simulation → Longstaff–Schwartz Monte Carlo
- Owned the SOFR curve: bootstrapped discount factors from convexity-adjusted SOFR futures and 1Y–50Y OIS swaps with cubic-spline zero rates, matching Bloomberg’s zero curve exactly; SABR (β = 0.5, Hagan 2002) fit Bloomberg VCUB normal vols across 98 expiry-tenor pairs at 0.38 bp mean smile error
- 50K-path antithetic LMM reprices the OIS curve within 0.03%; LSMC prices the Bermudan at $213,580 (100K paths, s.e. $844) — the European leg lands within 0.55% of Bloomberg, and the 9.4% Bermudan gap reflects the LMM vs HW1F model-class difference; sensitivities to correlation, vol, curve shape, SABR ρ and path count all move with the correct sign
Explainable YOLOv8 for Medical & Environmental Imaging
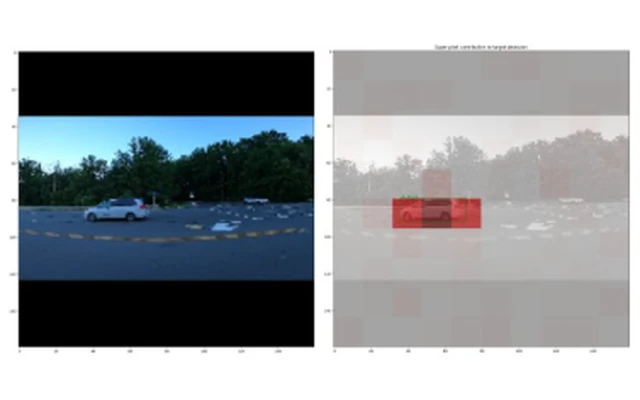
- Undergraduate thesis (four-person team) wrapping a pre-trained YOLOv8m object detector in an explainability layer, applying SHAP and LIME to show which image regions drive each detection
- Built a LIME adapter for object detection (custom predict_proba over detections) and ran explanations on street-scene, licence-plate and live-sports footage toward a litter-detection use case; found LIME’s local explanations too coarse for detection models and moved to SHAP attributions
- Extended the pipeline to medical imaging in collaboration with Princess Margaret Hospital (results confidential)